Floor Price Range (rFloor) | A Better Metric for Analyzing NFT Projects and Price Action

Floor price is one of the hottest topics of conversation in the entire NFT space. But how important is it?
Floor price indicates the lowest amount of Ether (ETH) one specific collector or holder thinks her NFT is worth. It also shows that there is no buyer at that price because if someone was willing to purchase the NFT, the floor price would rise.
The downfall of relying too heavily on floor price is that it only takes into consideration one collector or holder and not the entire project’s community. How many collectors or holders are willing to sell around that floor price? That’s where floor price range, or rFloor, comes in.
*Note: rFloor is available on Lucky Trader’s Project Rankings page under “10% Floor.”
rFloor is the number of total NFTs currently listed within a specified percentage range from the project’s current floor price. If a project has a floor price of 10 ETH and 25 NFTs are listed from 10 to 11 ETH, the project’s rFloor is 25. If a project has a floor price of 1 ETH and 11 NFTs are listed from 1 to 1.1 ETH, the project has an rFloor of 11.
rFloor is not necessarily tied to any specific percentage range (i.e. 10 percent from the current floor price or 25 percent from the current floor price). But 10 percent is a good starting place for general NFT project analysis.
How does rFloor help collectors when buying and selling NFTs? Here are three reasons rFloor is a better metric for analyzing NFT projects than floor price:
1. It’s a snapshot of collector confidence.
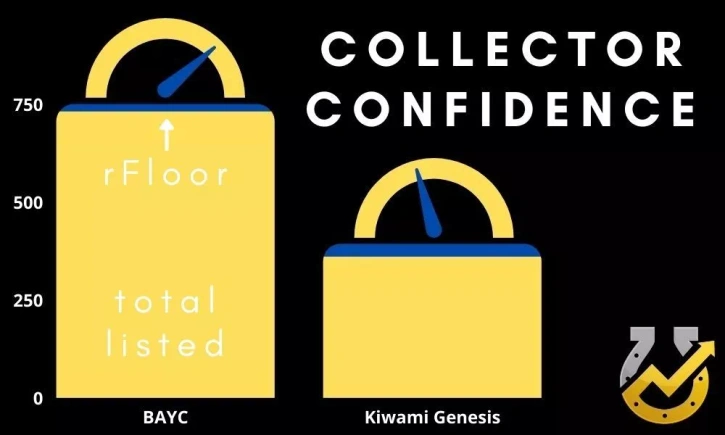
Floor price only shows the confidence level of one collector. But rFloor takes a snapshot of general collector confidence in an NFT project.
In low liquidity environments, the lowest price one collector will sell her asset for is largely irrelevant. One purchase rids the project of that collector and introduces a new, seemingly confident collector.
A sustained lack of interest in buying an NFT project’s lowest priced assets is clearly a bearish indicator. But it doesn’t necessarily indicate low collector confidence in the project.
rFloor, on the other hand, does indicate a generalized collector confidence. If only one NFT is listed within a 10 percent range of the project’s current floor price, it seems to suggest that the rest of the project’s collectors are unwilling to adjust their prices downward at the current price range, which indicates a high amount of collector confidence.
If 50 percent of all listed NFTs are currently within a 10 percent range of the project’s current floor price, it seems to suggest that a large number of the project’s collectors are willing to sell at the current price range, which indicates a low amount of collector confidence.
Indications of collector confidence are important for the long-term sustainability of NFT projects. And rFloor offers a better snapshot of overall collector confidence than isolated floor prices.
Note: rFloor is a good starting point for determining collector confidence, but other metrics like total number of NFTs listed, percentage of NFTs listed, rFloor / total number of NFTs listed, and more are worth diving into to help analyze NFT projects and price action.
2. It shows boom potential during increased buying periods.
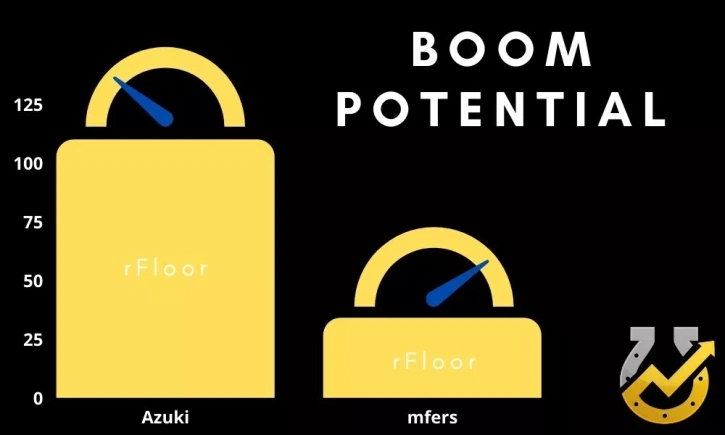
When an NFT project announces a catalyst for positive price action, the total number of assets listed within a certain percentage of the project’s floor price indicates its overall ability to rapidly increase in price. We’re calling this boom potential.
The more NFTs listed within 10 percent of the project’s floor price, the less boom potential it has when new announcements are released. If only a few NFTs are listed within 10 percent of the project’s floor price, it has greater boom potential.
Floor price can only indicate boom potential on one sale (i.e. a project’s floor is 1 ETH and the next lowest NFT is listed for 1.5 ETH, so “boom potential” is 50 percent). But rFloor can indicate boom potential during a run up, which is more beneficial to collectors and holders than one isolated incident.
Let’s assume a project’s floor price is 2 ETH. Let’s also assume a recent announcement increases overall buying pressure on that project by 100 ETH. If the project has 30 listings within 10 percent of the project’s floor and 50 listings within 25 percent of the project’s floor price, the floor price should increase somewhere between 10 and 25 percent during the run up.
If, however, the project has 5 listings within 10 percent of the project’s floor price and 30 listings within 25 percent of the project’s floor price, the floor price will increase over 25 percent and into the 25 to 50 percent range.
The latter has greater boom potential. And finding projects with increased boom potential and possible upcoming price action catalysts can help collectors find buying opportunities with positive expected outcomes.
3. It indicates potential buying and selling opportunities.
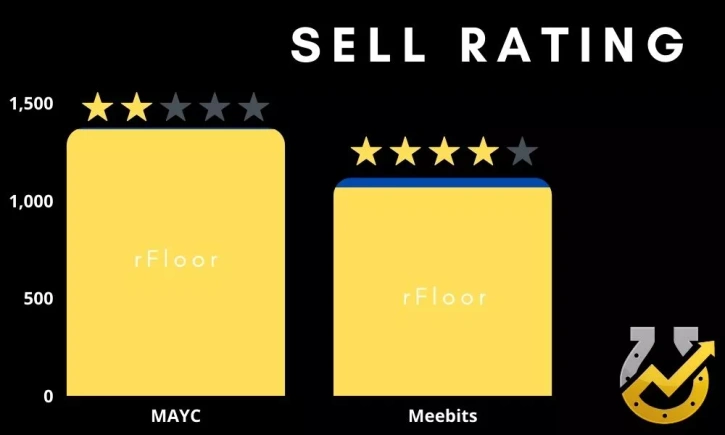
Similar to buy and sell walls in stock market and centralized cryptocurrency exchange order books, rFloor can help collectors determine when it is likely better to buy or sell NFT projects.
Sell walls, or multiple NFTs listed for sale near the current project’s floor price, are discouraging for upward floor price movement. Buy walls, or multiple offers on NFTs near the current project’s floor price, are encouraging for buyers.
Similar to a project’s boom potential, a project with a lower rFloor has a higher likelihood of upward floor price movement, as buying pressure breaks through the sell wall. Inversely, a project with a higher rFloor has a higher likelihood of downward floor price movement, as buying pressure is not strong enough to break the sell wall.
Estimating a project’s rFloor when it reaches a certain floor price is one method for determining good spots to buy and sell.
If a project has an rFloor of five or less at a 2 ETH floor price, but an rFloor of 50 or more at a 3 ETH floor price, it might make sense to sell into a run up around 2.75 to 3 ETH. If the run up does not break the sell wall at 3 ETH, it should revert downward before settling and consolidating.
Using rFloor to determine selling and buying opportunities can help collectors avoid negative expected outcomes during periods of FOMO (fear of missing out) and benefit from positive expected outcomes during periods of consolidation and potential run ups.
A Cautionary Note on Low Liquidity and Unlisted Assets
With low liquidity, unlisted assets, and a 24-hour trading window, the NFT space is wildly volatile. While trading metrics like rFloor are beneficial for speculative analysis, they cannot predict new listings, increased or decreased buying or selling pressure, and plenty of other external market factors that could lead to negative or positive floor price movement.
rFloor is meant to be used as a better way to measure collector and holder confidence in a project, the likelihood of upward floor price movement in the event of a price action catalyst, and better or worse times to buy and sell. It is not meant to be used as a magic 8-ball.
Buy, sell, trade, and collect with caution and at your own risk.