How Are NFT Rarities and Price Estimates Calculated?

If you’ve been browsing the Lucky Trader asset pages or using the Lucky Trader Chrome extension, you may have noticed two types of numbers stand out: rarity scores and estimated prices.
What do these numbers mean and why should you care? In this post, I’ll dive into explanations for each and how they’re useful while you’re shopping for NFTs - which should be especially useful for anyone just getting started! For the data-oriented NFT collectors out there, we’ll also explore how these figures are calculated.
What is a Rarity Score and Why Use One?
A popular type of NFT project is the “avatar” or “profile picture” project. These NFT collections typically have a limited number of NFTs where each one is randomly assembled from a fixed set of properties or traits.
Some NFTs win the lottery during the initial minting process and are composed of rarer traits, or traits that are present in fewer total assets.
These assets are harder to come by and, as is often the case with artwork, scarcity increases their value. As a result, rarity is closely tied with value in the NFT space.
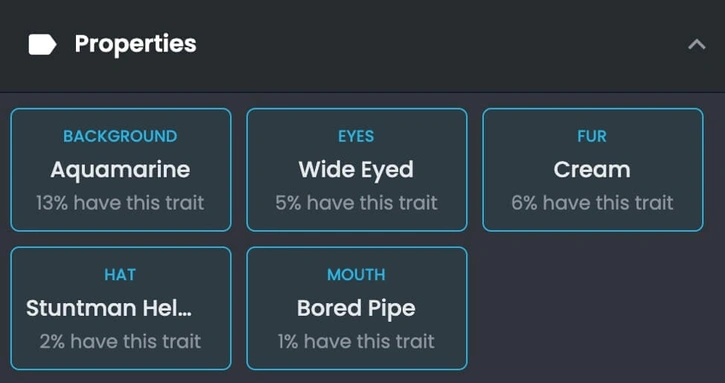
The above image indicates example properties for a Bored Ape Yacht Club NFT as displayed on OpenSea.
Our goal at Lucky Trader is to quantify the rarity of a given asset by assigning it a rarity score. Rarity scores serve as a useful barometer for NFT collectors, as they can quickly see how an asset stacks up against others in the collection in terms of rarity undefined.
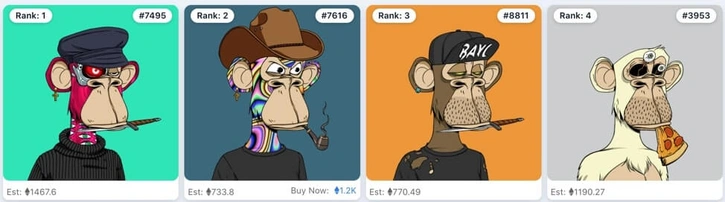
The Asset page on Lucky Trader sorts all assets in descending order of rarity score.
As you can see for Bored Ape Yacht Club (BAYC), the rarity rank is on the top-left corner of each asset card.
How Does Lucky Trader Calculate Rarity Scores?
Rarity may seem 100% objective, but there is actually some wiggle room during calculation and there are some subjective decisions when selecting an approach for quantifying rarity. This is why the Lucky Trader rarity rankings may differ slightly from other sites producing rarity rankings.
At Lucky Trader, we prefer a consistent approach across all NFT projects whenever feasible. We minimize the number of knob turns so that rarity is as objective and consistent as possible. Another massive benefit of this approach is speed - our site starts showing rarity scores as soon as a collection is revealed!
We use a streamlined approach of the “rarity score” calculation, which has quickly become the industry standard used by tools such as Rarity.tools and Rarity Sniper.
To calculate the rarity score of an asset, we first assign a score to each trait – which we’ll call the “trait rarity score.” The asset’s overall rarity score is simply the sum of all its trait rarity scores.
To calculate trait rarity, we take the total number of assets in the collection and divide by the number of assets with that specific trait - the fewer the assets that have the trait, the higher the trait rarity.
After, there is an additional normalization step for each trait. This allows each trait rarity score to be weighted properly when summed up in the overall rarity score.
How Are Rarity Scores Distributed?
So how do rarity scores look after they’ve all been calculated for a collection? Usually, each collection has just a handful of “super rare” assets that are far rarer than the rest. Most of the assets are at or slightly above the floor rarity score.
This is the case for collections like the Bored Ape Yacht Club. When we sort all of the rarity scores in the collection in increasing order, the resulting curve looks like this:
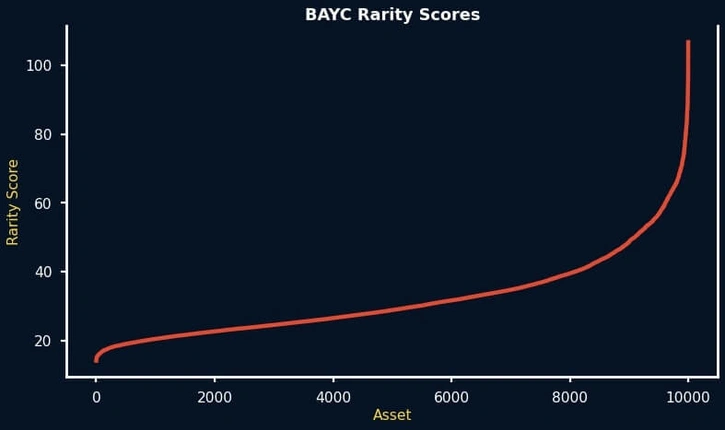
The curve spikes sharply upward on the right side, which means the top few hundred assets are exceptionally rare compared to the rest. If you have an asset that is at the very top of the rarity spectrum - congratulations! Those assets are exceptionally difficult to come by and are likely to be valued accordingly.
A lot of NFT projects have rarities distributed like BAYC, but there are some with even more dramatic imbalances of rarity. This time, let’s check out the rarity scores for CryptoPunks. Again, we sort all rarities in increasing order and plot them in a curve.
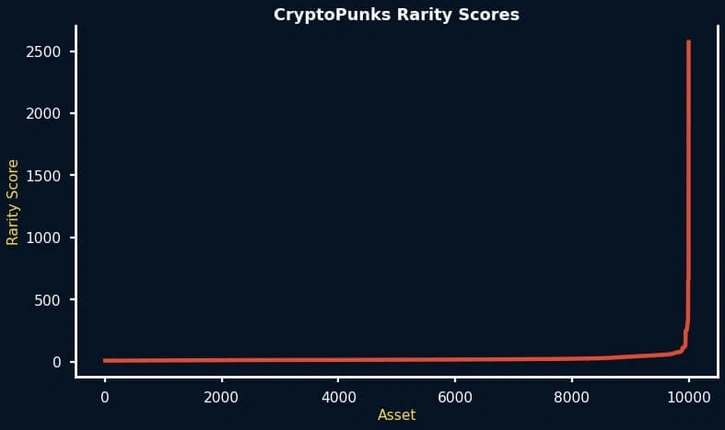
Check out that massive spike! The score increases gradually at first, which means the vast majority of punks are relatively similar in rarity. However, the top of the collection is exceptionally different, which includes special punk types like Aliens, Apes, and Zombies, as well as the unique 7-trait, 0-trait, and 6-trait human punks.
Long story short, consider yourself REALLY lucky if you have an NFT that ranks at the top of its collection.
Why Does Lucky Trader Provide Price Estimates?
Even though rarity scores are a good indicator of value, this isn’t always the case. At the end of the day, an asset is worth as much as someone is willing to pay for it. Given how subjective the valuations of NFTs are, there are plenty of other variables in play - such as its aesthetic appeal, cultural significance, and other less tangible qualities.
For example, let’s consider CryptoPunks. The 0-trait and 6-trait human punks are among the rarest Punks in the collection. In fact, the only assets that are rarer are the 7-trait punk and Alien punks.
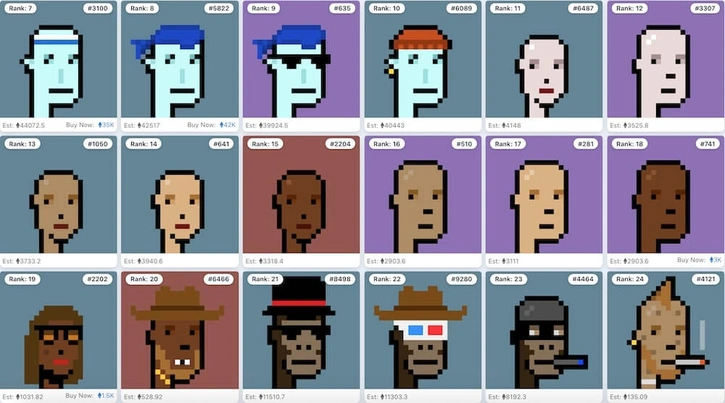
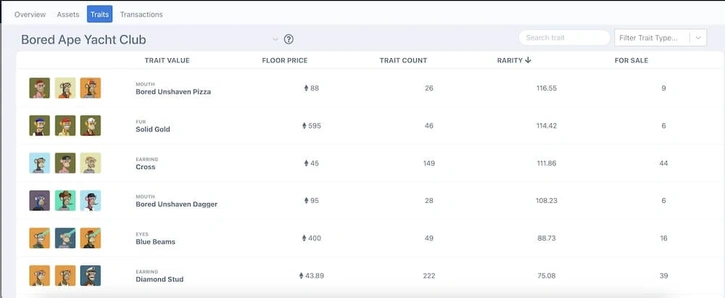
However, the 0-traits and 6-traits typically aren’t considered as valuable as other punks, most notably Apes and Zombies - and the sales history backs that up. The top sales of all-time include many Apes and Zombies, despite them being ranked lower in rarity than the 0-trait humans.
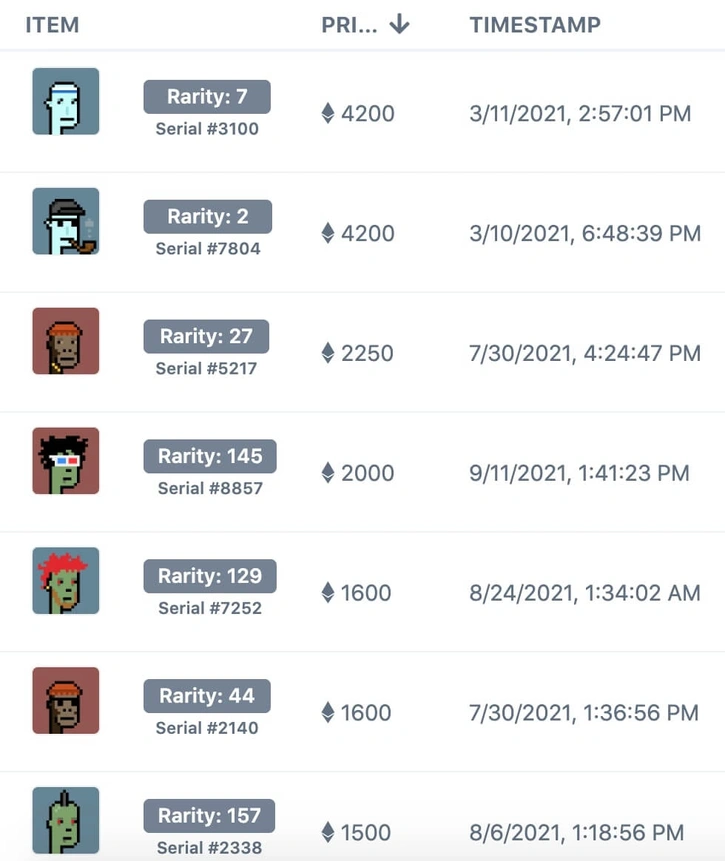
Comparing the two images above, we see a clear disparity between rarity and actual sales prices.
As a result, we need a separate system in place if we want better estimates of an NFT’s value.
How Are NFT Price Estimates Determined?
Prices are mostly speculative in the NFT world until deals are officially made. For that reason, Lucky Trader price estimates are driven heavily by completed sales. In addition to sales history, we use active listing prices and rarity scores as supplementary data points.
Our philosophy revolves around a key metric in the NFT world: the floor price. This is the lowest price that you can buy an asset within a collection. This is typically calculated as the lowest listing price on the secondary market.
In turn, a floor asset within the collection is an asset that would sell at the current floor price, but is unlikely to be purchased by if it were priced any higher. Floor assets are the least valuable and most common items of a collection.
While the rarest and most desirable assets fetch a handsome premium over the floor price, the remaining assets fall somewhere in between, where they may sell for a small premium over the floor. Our pricing model is trained to predict this as its target: how much premium does an asset have over the current floor price in the market?
Using the assumption for “premium over floor,” we train our model to predict a multiplier over floor for each asset in the collection. Our model relies primarily on historical sales as input data. We also take into account the asset’s rarity score and the floor price of its rarest trait. Finally, we blend these factors into a final price prediction.
If a particular asset has been traded many times, we take those individual sales with great weight. If it has never or rarely been traded, then we’ll weigh sales of similar assets (based on traits) and rarity score with greater emphasis.
Here’s one big thing to remember about our price estimates: they are what we expect to be fair market value at this moment in time. They are not a prediction for how much they will be in a week, a year, or 50 years from now.
The distribution of actual prices are similar to that of rarity scores. The high-end assets fetch a very high premium, while most assets are grouped close to the floor.
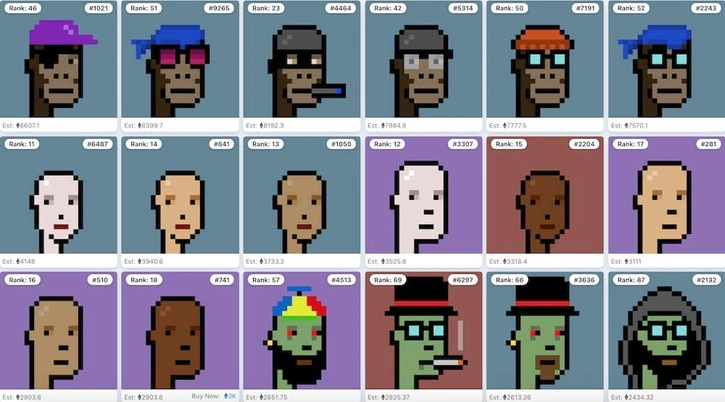
As a result, our final price estimates have all Apes valued higher than 0-trait humans, despite them having lower rarity scores.
Conclusion
We’re excited to unveil our rarity scores and pricing estimates on Lucky Trader, which will soon be populated for all collections on our platform. We value our estimates highly, but please keep in mind that they are exactly that - estimates.
The rarity scores are more objective since they are driven by statistical rarity of known, static traits. However, prices are much more dynamic and subjective, especially given how quickly the NFT world moves.
We hope that you use our tools to your best discretion and make great deals in the NFT world. Good luck and happy trading!
Disclaimer: Lucky Trader is not a registered investment advisor. You understand that the service is furnished for your personal noncommercial, information, purpose only. No mention of an NFT in the service constitutes as a recommendation to buy, sell, or hold that or any other NFT. Nothing within the service shall, or is intended to, constitute financial, legal, accounting, or tax advice. Any decision that you make to buy, sell, or hold an NFT should be based on an assessment of your risks in consultation with your personal advisers.