Straight Line Bias and How to Avoid It When Analyzing NFT Trends

Straight line bias is our natural tendency to project the past into the future. When we see a pattern start to develop in a linear fashion, our immediate inclination is to assume that pattern continues to progress along a linear line forever. Of course, with additional information, we can override that basic assumption, sometimes before it even begins.
Consider the chart below. Instinctively, without reading axis labels, our human brain wants to project that the line continues off the chart in a linear way forever. That would make the average male 138 inches, or 11 feet and 6 inches, at age 32. Projecting even further, the average male at age 64 would be 276 inches, or 23 feet tall.
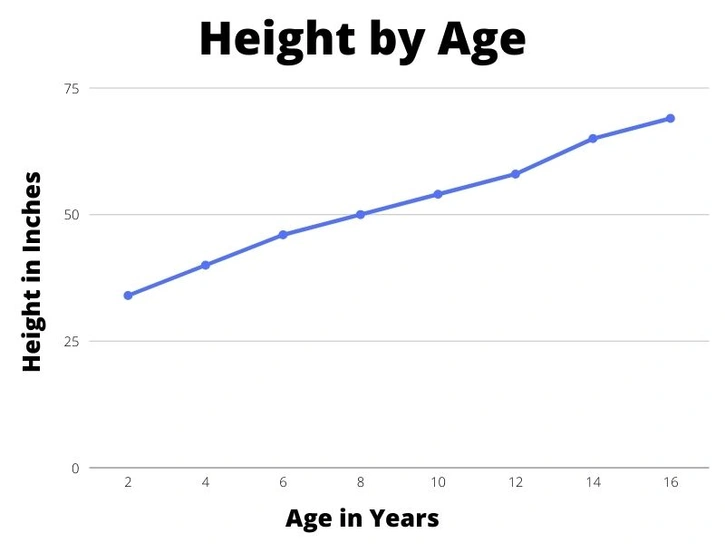
We obviously know how absurd such a prediction would be, considering no human has ever grown to 23 feet in recorded history. But it goes to show how bad we are at predicting future outcomes and how our straight line bias is a major part of that fallibility.
In this article, we’ll look at a few more examples of straight line bias in the real world, discuss how curves more accurately mirror reality and predict the future, and how recognizing these inherent biases can help make you a better NFT and cryptocurrency analyst.
Special thanks for Hans Rosling, Ola Rosling, and Anna Rosling Ronnlund for their book, Factfulness: Ten Reasons We’re Wrong About the World - and Why Things Are Better Than You Think. This article builds on key ideas presented throughout the book, and most specifically Chapter 3: Straight Line Instinct.
Identifying Straight Line Bias in the Real World
Overgeneralization, which is the foundation of straight line bias, has its perks. When fighting for survival in life and death situations on a daily basis, as our ancestors did, carefully analyzing information to more accurately predict the future cost us valuable seconds that could’ve been spent running away from dangers. Imagine a lion attack in the African savanna and there you are calculating the realistic probability that the rustling grass is a man-eating cat. You probably wouldn’t have passed on your precious genes.
In contemporary times, we don’t usually have to worry about big cat attacks. Most of the time, we don’t have to worry about danger at all. Yet, we still cling to oversimplifications and jump to rash conclusions. It’s just who we are – overly optimistic about the future when the waters are smooth sailing and overly pessimistic when the waters get choppy.
Optimism Bias, or Wishful Thinking
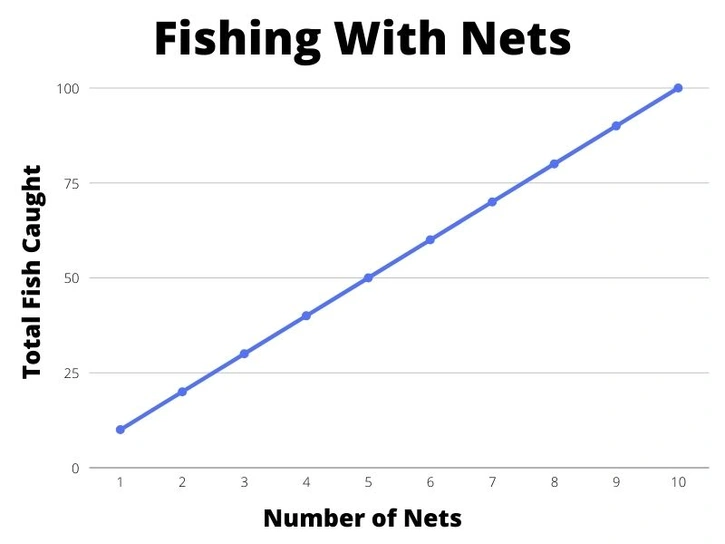
Consider a fisherman who just crafted his first net. He tosses it into the water one day and catches five fish. Wow, what a success! He adds onto his net and makes it twice as big. He casts it into the water and catches 10 fish. He builds a second net and tosses both nets into the water. Bam, 20 fish! He just solved the food scarcity problem for his village, and he can’t wait to go show everyone his new magic tool. In his mind, this is what the future looks like for the village:
What he doesn’t see, or even consider, is the total number of fish in the village’s water source. Here is what that looks like:
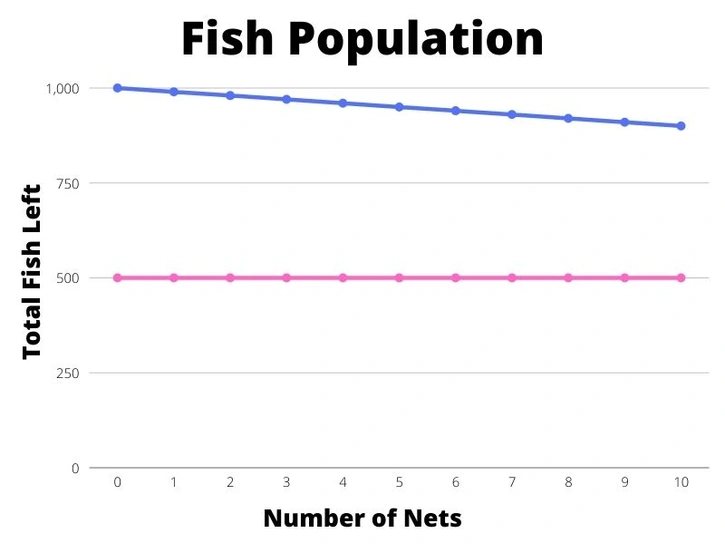
The blue line represents how many fish are left in the water source after the fisherman casts his total number of nets. The pink line indicates the total number of fish required to maintain the current population during breeding season. With 10 nets, the fish population will continue to grow. But the fisherman, in all his hopeful optimism, tells the entire village of his successes with his nets. Every villager, also wanting to feast on as many fish as possible, built a net. The village had 250 people. Let’s see what happened to the original chart.
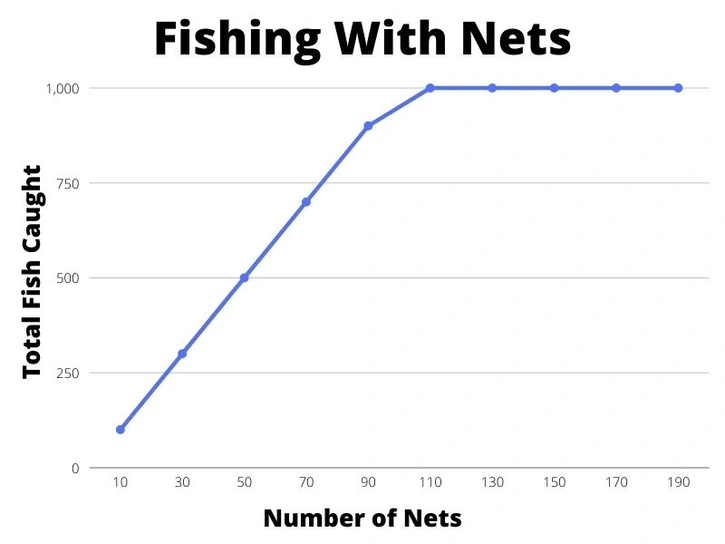
Whoops, all the fish are gone and less than half the villagers believe in the fisherman’s fairy tale about magic nets.
Pessimism Bias, or Catastrophizing the Future
Overgeneralization happens in both directions, and perhaps more frequently when catastrophizing the future because of our inherent negativity bias. Let’s look at the growth of the world population since 1950.
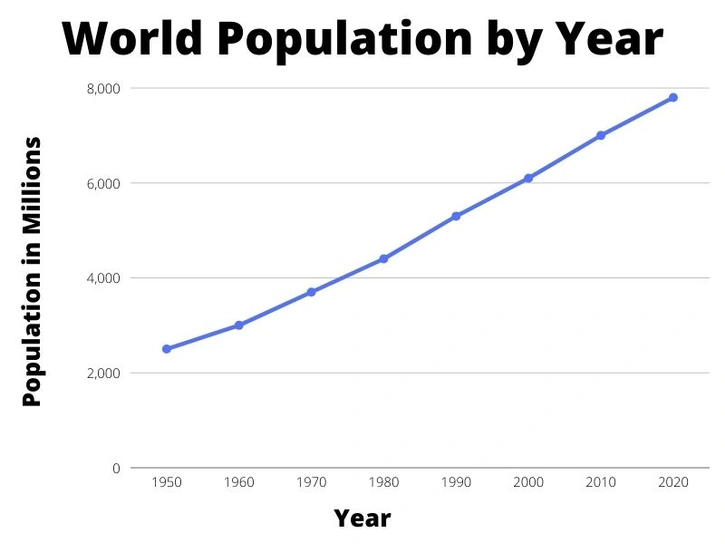
This is probably an argument that you’re already intimately familiar with: the world population is growing rapidly and the future generations are going to suffer from lack of space, food, etc. The former is certainly true. The world population has grown at an exponential rate since the start of the 1900s. And it is expected to continue to grow until 2100. But it will level out, and the reason for the increase is a longer average expected lifespan for adults, not new children.
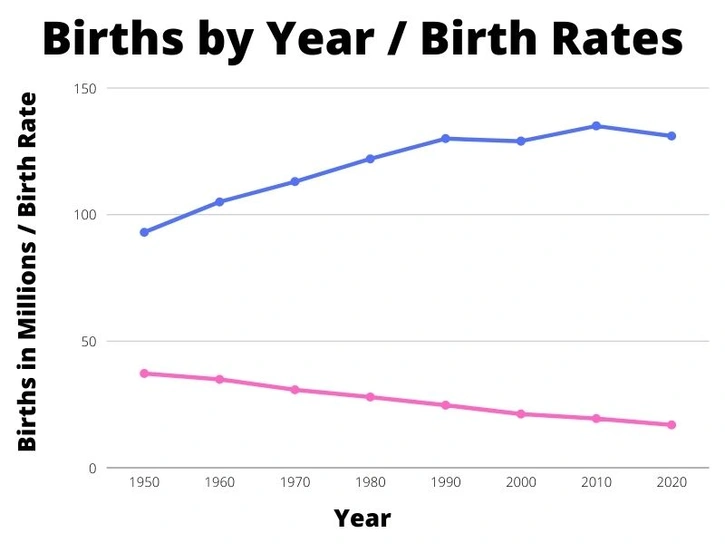
The blue line shows births in millions over the last 70 years. The pink line shows birth rates per 1,000 people over the last 70 years. The UN projects that births and birth rates will continue to decrease over time, as more of the world’s population is educated and able to afford contraceptives. But more children will live thanks to vaccines and modern medicine, continuing to increase the population until it steadies out in about 100 years.
As the people who were born during the exponential growth period live long, healthy lives and eventually die, the population will plateau. It is expected to plateau around 12 billion. This plateau effect is expected to continue into the future, so the human population will remain 12 billion in 2200 rather than reach 20 billion or more.
Catastrophizing happens in the cryptocurrency and NFT space all the time. Every dip is met with memes of McDonald’s applications for traders and investors. Every spike is met with the “up only” mentality, where Bitcoin (BTC) or Ethereum (ETH) is going to “rocket to the moon.” This year, we saw projections of half a million USD per BTC and $10,000 per ETH by January when the sailing was smooth. During rough waters, we saw projections of $8,000 per BTC and $300 per ETH.
Wishful thinking and catastrophizing the future are going to continue to happen, especially in volatile spaces with confusing charts and endless Twitter hype. And it’s okay to be excited or upset when assets increase or decrease in value, but make sure to continually ask yourself if you’re succumbing to straight line bias. Recognizing the bias is the first step toward us making more informed and better predictions about future events.
The World Is Made Up of Curves, Not Straight Lines
The world is messy and predicting the future is complicated. As Adam Levine of Maroon 5 so adequately puts it, “it’s not always straight lines and butterflies.” Or something like that.
The world is made up of curves, bends, and surprises. What worked yesterday might not work tomorrow. We have to be cognizant of that. To help better predict the future, here are four different curve patterns (displayed via NFT project charts) that are more common in reality than straight lines:
1. S-Bends
An S-bend is when a line starts semi-straight, curves up exponentially, then flattens out again at the top. It looks, obviously, like the letter S. One good example of an S-bend is the Bored Ape Yacht Club’s (BAYC) price chart.
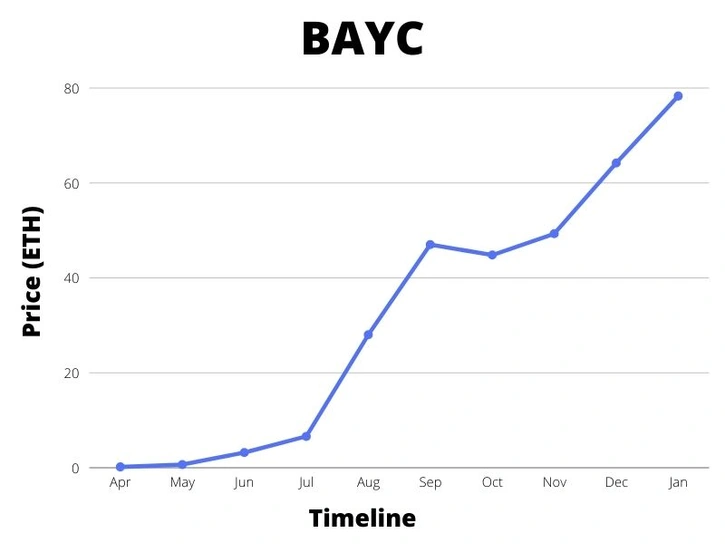
In April, May, and June, BAYC slowly increased over time. Then, all of a sudden, exponential growth happened, and the project peaked in the upper 40s for a couple of months. Now, it looks like potentially the start of another S-bend.
In late August and early September, straight line bias probably kicked in for a lot of collectors, traders, and investors. How could this project possibly stop growing so fast? It has grown every month since launch on average, right? Yes, it did. But it wasn’t going to go up forever. When it peaked in September, the semi-flat line until November was encouraging.
Any number of possible outcomes could have come to pass. The chart could’ve started a reverse S-bend (slide) or a hill. That would’ve been less than ideal for those who bought during the run up. Fortunately for BAYC holders, it held steady and continued to rise over time. This was simply a consolidation period.
Regardless of outcome, recognizing that S-bends are one of multiple possibilities for price charts will help collectors, traders, and investors more accurately predict future outcomes. If you refuse to recognize the straight line bias, you might’ve bought in September and sold immediately in October because “BAYC was headed to zero.”
2. Reverse S-Bends (or Slides)
Reverse S-bends, or slides, are the exact opposite of S-bends. The chart starts off at the peak, stays level for a while, then dramatically rushes downward, and eventually levels out. The shape looks just like a slide at a playground. Let’s take a look at the CrypToadz price chart.
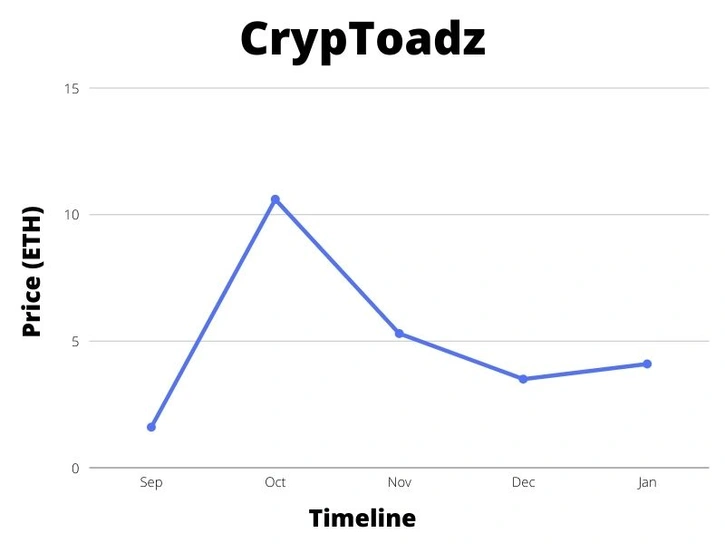
It is, of course, impossible for a successful NFT project to start as a slide. But starting in October, CrypToadz dramatically fell from over 10 ETH to slightly over 5 ETH in November. It continued to fall, though less dramatically into December. Then, it evened out into January. This chart from January into the future could be the start of a valley, an S-bend, or even (it is possible, after all) a straight line up.
Again, from September to October, it felt like CrypToadz would be “up only.” That turned out to not be the case. Understanding all potential outcomes is important for making predictions.
3. Hills and Valleys
The crypto and NFT space is filled with hills and valleys. Periods of massive accumulation are followed by selloffs, and periods of massive market dumping are followed by increases in buy orders. The volatile market continues an overall upward trend, but it is far from a straight line. Let’s take a look at the CryptoPunks price chart (perhaps the best indicator of the overall NFT market).
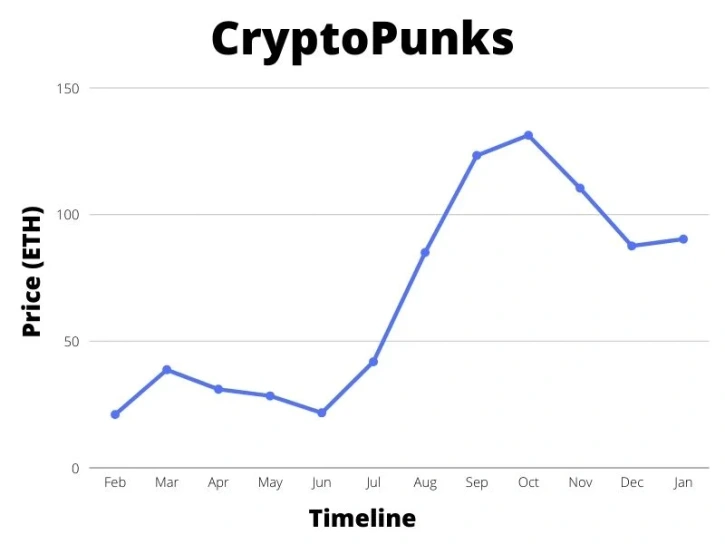
From February to June, the CryptoPunks chart shows a hill. It increased rapidly from February to March, then decreased over time to form the hill. But in June, the bottom of the valley is carved out. The chart increases rapidly in July, and this time, it grows exponentially until September. Then it flattens out and creates a slide.
Overall, CryptoPunks have earned holders over 100 percent in gains from February 2021 to January 2022, but again, that path was far from a straight line. There are going to be hills, valleys, S-bends, and slides. Preparing for this will help you not overreact when the market shows its volatility.
4. Exponential Curves
Exponential curves are what all collectors, traders, and investors are looking for on price charts. An exponential curve, or doubling line, is when a chart continues to double over time. A penny becomes two pennies, becomes four pennies, becomes eight pennies. In the beginning, this doesn’t look like much, but over time, that one penny becomes millions of dollars.
The closest chart the NFT space has to an exponential curve right now is Doodles.
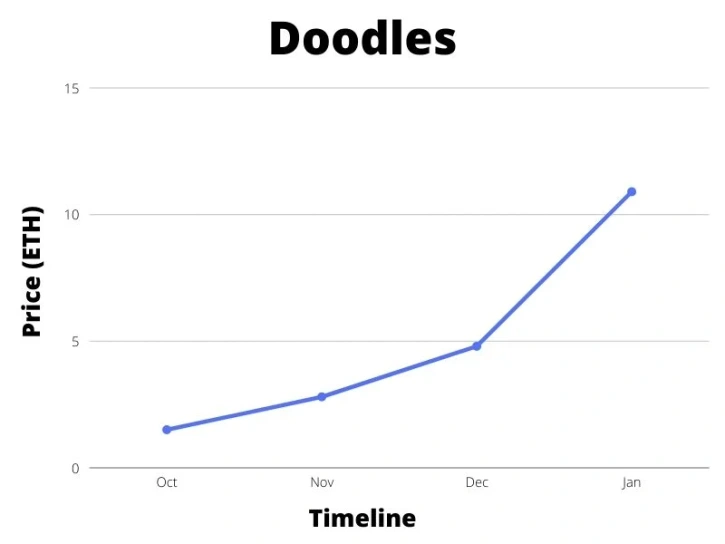
From October to November, the floor price goes from 1.5 to nearly 3 ETH. From November to December, it goes from 3 to nearly 5 ETH. Finally, it goes from nearly 5 to over 10 ETH. If this were to continue into the future (it won’t), Doodles would be 160 ETH by May.
With context, we can assume that Doodles will either form an S-bend or hill rather than continue along the exponential curve. In other words, it is due for an accumulation period where the price remains consistent or decreases.
Exponential curves do show up in reality quite often, though. Population growth, infectious disease spread, and more all increase, at times, exponentially. Eventually, the chart tops off, but identifying exponential growth from straight line growth is a huge advantage in predicting future outcomes.
Tips for Analyzing NFTs With Limited Bias
We’ve already started to see how this information is relevant to NFT analysis. It helps us better predict the future. We are, of course, not fortune tellers. The future is never clear to us. But we can make better or worse predictions about the future that are more or less attuned to reality and realistic outcome percentages.
Avoiding straight line bias can help us become more successful collectors, traders, and investors. Here’s how.
Seek Out Opposing Viewpoints
Stop existing in an echo chamber. Opposing viewpoints are much more helpful in the verification of your own thoughts and ideas, and you should seek them out. Even if you ultimately decide that the viewpoint you held prior to hearing the opposing viewpoint is still correct, you’ve discounted one potential counterargument. The more counterarguments you discount, the more confident you can be in your original viewpoint.
Straight line bias is perpetuated in echo chambers. If everyone around you is saying that it is “up only” for an NFT project or cryptocurrency token, you’re more likely to believe it. Find the haters, see what they’re saying, keep an open mind, and verify your viewpoint against evidence to the contrary. It might just save you from holding a Blitmap from a 30 to 5 ETH price floor (definitely not speaking from experience here).
Question Everything (on Twitter)
Twitter is not the New York Times, Wall Street Journal, or Washington Post. Information is judged based solely on the court of public opinion. It does not have to be verified as accurate or vetted or even sourced. Question everything.
In questioning everything on Twitter, you’ll automatically seek out opposing viewpoints. To ask, “is this true?,” assumes a level of skepticism that will counter your straight line bias.
Avoid ‘Fear of Missing Out’ (FOMO)
Living in the echo chamber that is Twitter is bound to produce FOMO, or fear of missing out. Everyone is buying this NFT or that cryptocurrency, so I should too. At times, that line of thinking does result in your desired outcome, but the process is entirely wrong. If you would’ve FOMO’d into BAYC in June and held you’d be quite happy. But if you FOMO’d into every NFT project that gained Twitter hype, you’d be broke.
Instead of FOMO’ing into cryptocurrencies or NFTs, question everything and seek out opposing viewpoints. You don’t have to be an expert on tokenomics or spend 24 hours a day reading NFT roadmaps to be successful in the space. You do, however, have to know who to trust, who to distrust, remain open-minded, and always be skeptical of straight lines. Find trustworthy sources who don’t fall victim to straight line bias. Ignore Twitter hype and narratives. And never fear missing out. There are always new opportunities.
Don’t Overfish the Pond
Assuming you’ve listened to the above tips and you’re now a successful NFT and cryptocurrency collector, trader, or investor, don’t overfish the pond. The more fishermen that enter the pond, the quicker the supply of fish dries up. It’s better to find a new pond before that happens.
Of course, this advice isn’t about fish. It’s about supply, demand, and price action. The pond is a growth industry, a subsection of the overall market. Let’s call it cute pfp (profile picture) NFTs. They’re adorable, they quickly take over Twitter, the price of most of them skyrocket, and the straight line bias kicks in. These fish are worth a ridiculous amount of money, way more than in other ponds. If you’re lucky, you’ve been fishing in that pond for some time undisturbed by other fishermen.
But soon everyone notices the pond. They all start to build nets and cast them out. What’s going to happen to the fish? They’ll catch a lot of them at first and make some money. Then, the pond gets overfished. You don’t want to be the one fishing in an overfished pond. Eventually, you pull in the net and it’s empty. Move to the next pond before that happens.
Conclusion
Straight lines rarely happen in real life. The world is more complicated than that. It’s filled with S-bends, slides, hills, valleys, and curves. Avoid the straight line bias to better predict the future by seeking out opposing viewpoints, questioning everything (on Twitter), avoiding FOMO, and finding a new pond before the one you’re in gets overfished. Good luck, and wagmi.
Disclaimer: Lucky Trader is not a registered investment advisor. You understand that the service is furnished for your personal noncommercial, information, purpose only. No mention of an NFT in the service constitutes as a recommendation to buy, sell, or hold that or any other NFT. Nothing within the service shall, or is intended to, constitute financial, legal, accounting, or tax advice. Any decision that you make to buy, sell, or hold an NFT should be based on an assessment of your risks in consultation with your personal advisers.